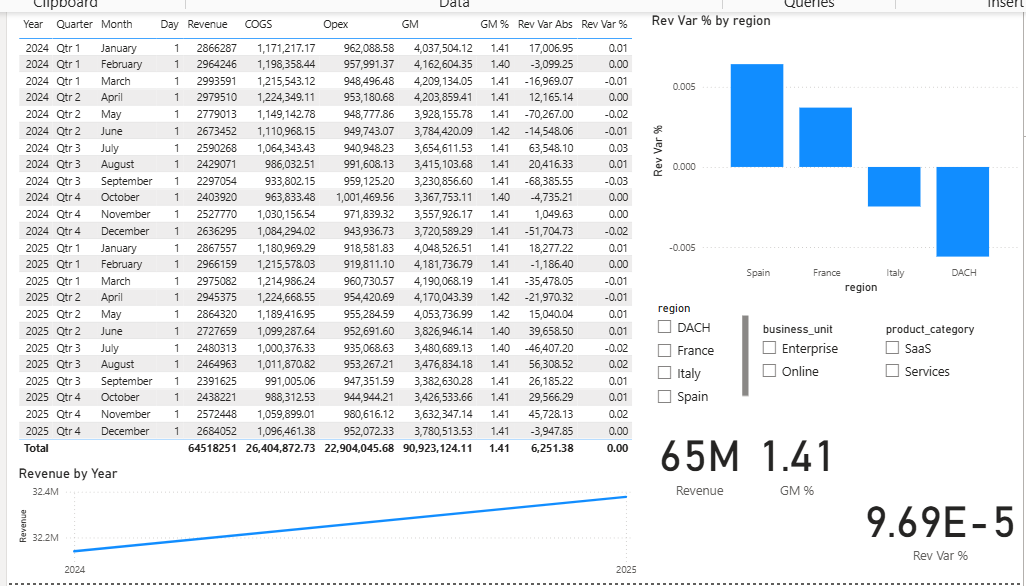
Sales & Margin Dashboard
End-to-end Power BI dashboard with star schema, DAX measures, and executive KPI tracking for sales and margin performance.
Power BI
DAX
Excel
View Project
GitHub Repo
FP&A Driver-Based Model
Rolling forecast model with revenue drivers, COGS, OPEX levers, and variance analysis, enabling strategic planning.
Excel
Power Query
Scenario Analysis
View Project
GitHub Repo

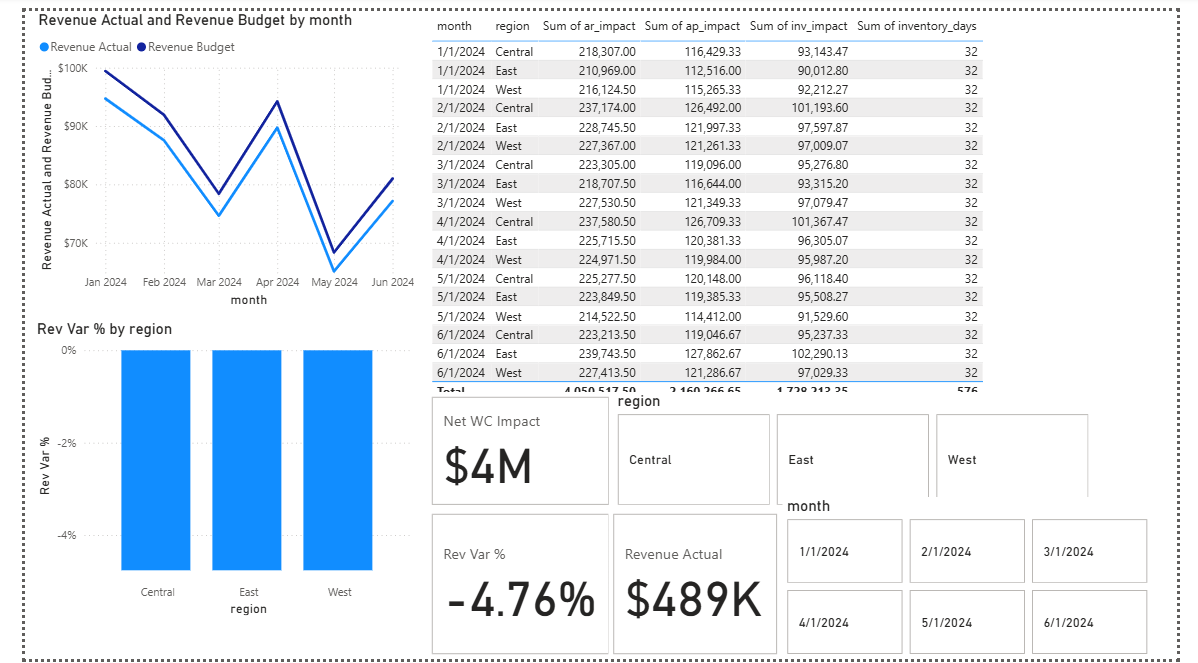
Retail Ops 360 — FP&A Dashboard
Power BI + SQL star schema on ~1M rows. KPIs (Revenue, GM%), Revenue vs Budget, Treemap + tooltip, Margin Bridge, Inventory Turns.
Power BI
SQL Server
DAX
Star Schema
GitHub Repo

Market Trend Dashboard
Interactive Power BI dashboard visualizing market share, competitive performance, and pricing trends.
Power BI
Data Modeling
Data Visualization
View Project